Market timing or time in the market?

Which should you focus on?

Article Hero Image

Peter Lynch once said, “Market timing is speculating and it rarely, if ever, pays off.” In the long-run stock prices rise, but in the short-run they are notoriously hard to forecast. No matter what increments of time are examined – days, weeks, or years – stock markets tend to go up roughly two thirds of the time.

With the odds so overwhelmingly in favour of gains, why do so many investors fight those odds trying market timing? Market pullbacks are frequent, and avoiding just a few of them could potentially add significantly to investment results.

But attempts at market timing to avoid pullbacks more often lead to missing out on significant advances. And missing out on just a few of these can be devastating for investment results. In almost all circumstances, the fundamental key to successful investing is having the discipline to stay invested. Time in the market, rather than market timing, is what creates wealth.

Stocks tend to go up

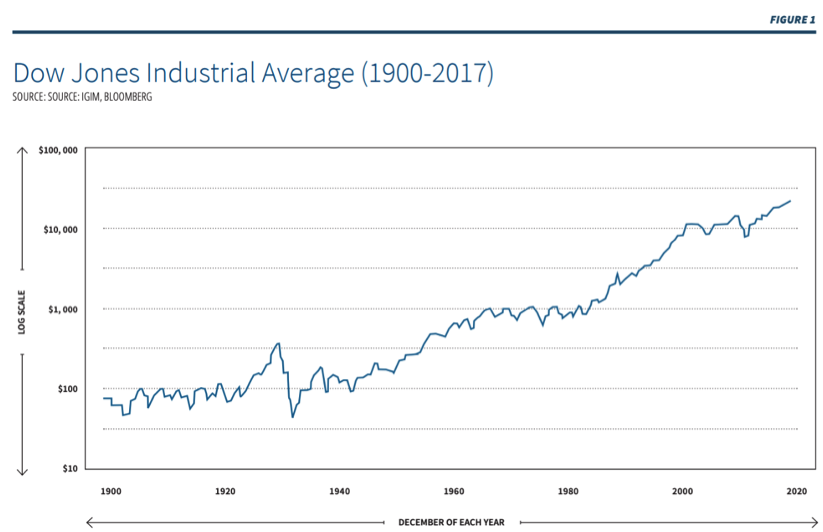
Figure 1, below, shows US equity returns over the course of the last 120 years. With a long enough perspective, the most dramatic equity market selloffs (with the notable exception of the 1929 crash) begin to look like mere noise in a seemingly relentless advance. This includes the 2008 “great recession”, the bursting of the dot-com bubble and even the crash of 1987.

This really illustrates the consistency of positive long-term returns in equities. In fact, according to Merrill Lynch, $1 invested in US large company stocks in 1824, with dividends reinvested, would have been worth almost $7 million by the end of 2016. Granted, two hundred years is not a realistic time horizon, but many investors today experienced the great bull market of 1982 to 1999, where US stocks returned 1654%. And more recently, US large caps returned over 250% since the low of March 2009. With a decent time horizon, market timing shouldn’t even need to be considered.

Year-to-year returns are unpredictable

If the upward trajectory of stocks over the long term is, as Charles Ellis said, never surprising, why is it so difficult for investors to stick to a disciplined long-term investment plan instead of market timing? Because, as Ellis also says, the short term is always surprising. Figure 2a depicts the distribution of S&P 500 calendar year returns since 1926, broken down in to positive and negative return years.  

Figure 2b presents similar data for Canada’s S&P/TSX composite index since 1948. A few observations stand out:

The returns are distributed in a classic ‘normal distribution’ pattern, or bell curve, where typically about 68% of values are found within one standard deviation from the mean. In this case, the mean appears to lie within the +10% to +20% column for the S&P 500, and within the 0% to 10% column for the S&P/TSX. For the US benchmark, the limits of one standard deviation on either side lie within the 0% to -10% and the +30% to +40% buckets, while in Canada they fall in the same range on the low side and between +20% to +30% on the high side.

In roughly 74% of the instances in the US, returns are positive (67 of the 91 years), while in Canada positive results occurred almost as frequently at 70% of the time (48 of the 69 years).

There is no obvious pattern in the returns based on their chronological sequence. That is, the location of any one year’s data point provides no clue as to the likely position of the next year’s location on the graph. It is perhaps, in part, the apparently high incidence of negative calendar year returns (US 26%, Canada 30%) that tempts many investors into mistakenly believing that value can be added through market timing, or tactically moving in and out of market exposure based on near-term forecasts of expected market returns.

The fallacy of forecasts

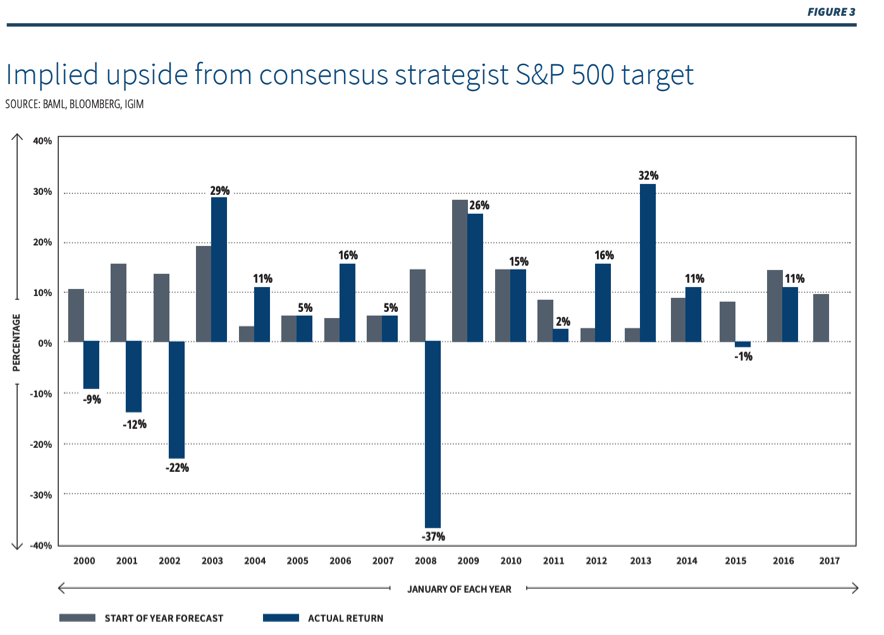
If one could simply predict how the market would perform each year, market timing would make so much sense. But not even the experts can pull this off. So how is the average investor likely to do any better? Let’s look at figure 3. The grey bars depict the consensus of Wall Street analysts and strategists at the beginning of each year, using an expected return from the S&P 500 for the calendar year. Note that the consensus always starts the year with a positive number, perhaps the safest guess considering how we’ve just seen the market deliver a positive return roughly 70% of the time).

The blue bars indicate the actual return experienced by the market benchmark each year. The consensus is almost always wrong and often dramatically so. Look, for example, at 2002: analysts expected a return of +14% and the realized return was -22%. Or 2008, where expectations were for +16% and the actual return was -37%. In 2013 analysts expected only +2% and the market roared ahead +32%.

Clearly one should not put too much stake in what the experts predict for financial markets year to year. The problem with market timing, therefore, is that you can’t predict the markets in the short term. What is predictable is that markets will advance over time, so let time be your friend.

Instead of market timing, stay focused and stay invested

Investors without a long-term plan, or the focus or discipline to stick to it, are more apt to follow the crowd responding to short-term noise. One of the most common market timing mistakes is to sell in response to a sudden or dramatic downturn and thus crystallize what had been until then just paper losses. These investors are then left on the sidelines, un-invested, when markets recover.

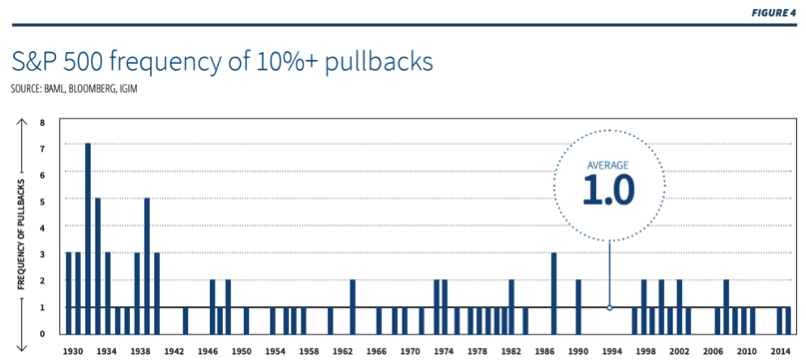
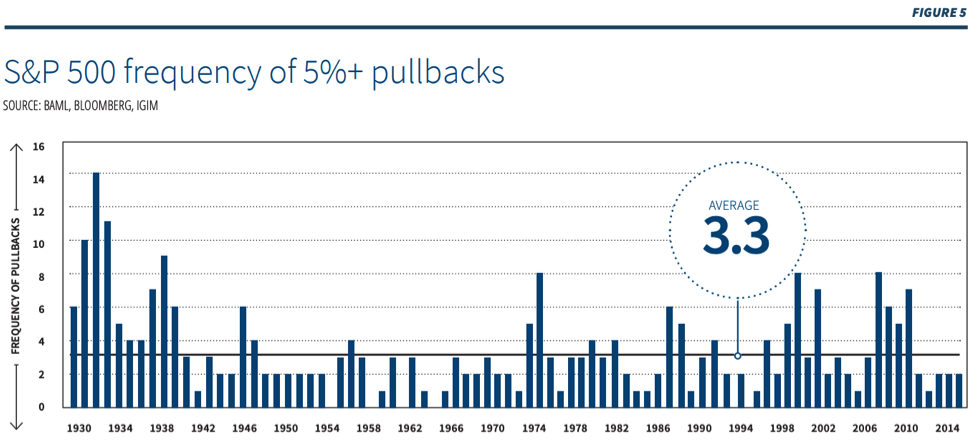
It's important to realize just how common significant downdrafts are. According to research from Bank of America Merrill Lynch (illustrated below in figures 4 and 5) since 1930, the S&P 500 has experienced a 10% pullback on average once per year and a 5% pullback on average three times per year. This shows how market timing could be so fraught.

More importantly, as figure 6 shows, in no way do large intra-year declines diminish the likelihood of annual returns finishing in positive territory. Despite the average year since 1980 experiencing an intra-year decline of -14%, the S&P 500 has delivered positive returns in 29 of 38 (or 76%) of calendar years.

We’ve seen how market timing (by trying to successfully predict near-term market direction) is difficult even for the pros. But each market-timing tactic is doubly difficult, as it requires two successful decisions: when to sell and when to buy back in. Waiting to confirm that you have actually seen a “bottom” usually means missing out on a significant portion of potential returns, as returns tend to occur disproportionately early in a recovery.

Attempts at market timing can be costly

Most big moves in the market, both up and down, tend to be concentrated in short periods lasting just a few days at a time. A commonly cited rule of thumb suggests 90% of the market’s absolute return is typically accounted for by moves on only 10% of the trading days. A 1994 study of all the trading days in the preceding 31 years concluded that 95% of all the market’s gains were generated by just 1.2% of trading days, or an average of only three days per year.1

To illustrate the importance of this concept, figure 7 compares the compound annual price return of the S&P 500 over the 20 years ended December 31, 2016, to the theoretical results if participation in the market was excluded for just the 10, 20, 30, and 40 best days of this 5000+ trading day period. An investor who hypothetically remained invested in the S&P 500 throughout this period would have earned a total annualized return of 7.7%. A notional investment of $100,000 at the beginning of this period would have grown to roughly $440,000.

By excluding just the 20 best-performing days in that time period, the compound annualized return drops to 1.6%, and the end value of the investment to just $136,000. By excluding the 30 best-performing days (still less than 1% of the trading days in the period) the total return becomes negative, eroding the initial investment to barely $90,000. Attempts at market timing can be disastrous.

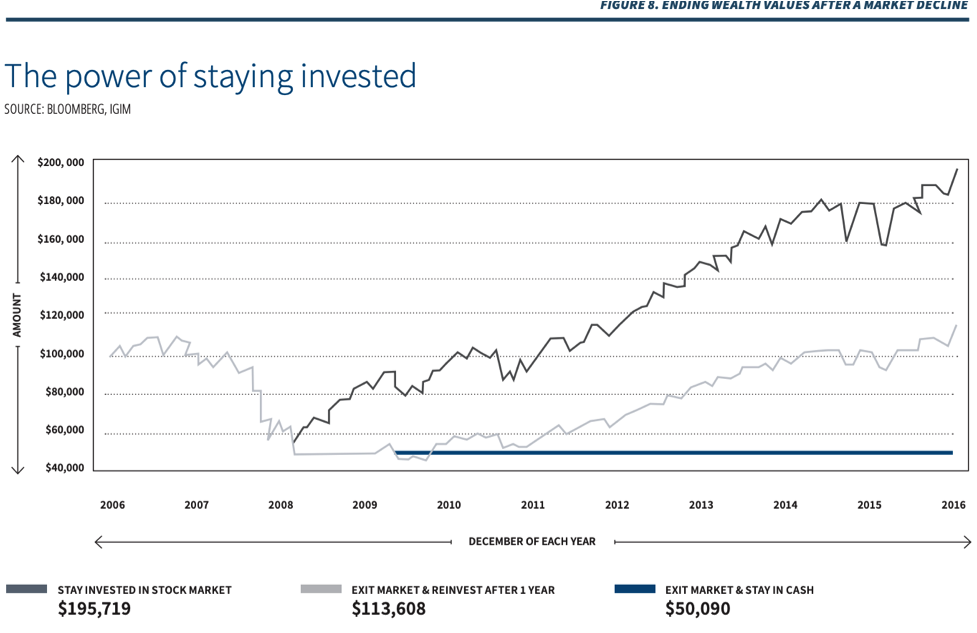
Figure 8 illustrates the importance of staying invested by looking at the value at the end of 2016 of a notional $100,000 investment in US equities, as represented by the S&P 500. Held throughout the decline of the 2008 recession and the subsequent recovery, it is compared to an investment sold at the bottom (or at the peak of market despair) and reinvested one year later when recovery looked more assured.

Seven years on, the “stay-invested” portfolio has grown to a level more than 70% higher than its fleet-footed counterpart (the data assumes reinvestment of income and does not account for taxes or transaction costs).

Rather than market timing, let time be your friend

As we saw in figure 2, the S&P 500 has had negative calendar year returns 26% of the time since 1926, which means the market has been up almost three of every four years. In Canada since 1948, the S&P/TSX has delivered negative returns on a calendar year basis 30% of the time. According to Bank of America Merrill Lynch, the likelihood of the S&P 500 returning a negative result over any one-year period (that is to say, not just calendar years) within this time is 27%. And the likelihood of experiencing an overall negative return diminishes as the investment term lengthens.

Also according to Bank of America Merrill Lynch, the likelihood of the S&P 500 experiencing a negative return over any five-year period is only 11%, and the likelihood over any 10-year period is only 6%. By extending the rolling study period to 15 years, the likelihood of a negative return drops to 0% – which is to say that from any starting point since 1926, US stocks as represented by the S&P 500 have always generated a positive 15-year return.

A review of the range of rolling returns experienced by the S&P/TSX since 1956 (figure 9) reveals a similar pattern of decreasing likelihood of negative returns as time passes. In the case of the S&P/TSX, the empirical likelihood of experiencing a negative return is eliminated even earlier: within the 10-year horizon. In addition, the longer the time horizon considered, the tighter or more stable the range of investment returns potentially experienced.

When downdrafts do occur, it is impossible to predict how long they will last. What is easier to predict is that attempts at market timing, by staying on the sidelines, looking for an optimal re-entry point, usually results in missing out on what is likely to be the most powerful portion of the rally from the bear market lows. The most important decision leading to long-term investment success is the decision to be invested and to stay invested. Let time be your friend.

Source

1 H. Nejat Seyhun, University of Michigan, “Stock Market Extremes and Portfolio Performance”

Written and published by IG Wealth Management as a general source of information only. Not intended as a solicitation to buy or sell specific investments, or to provide tax, legal or investment advice. Seek advice on your specific circumstances from an IG Wealth Management Consultant.

blue background

Speak to an advisor

Connect with an IG advisor to uncover your personal financial goals, and how you can achieve them.